Quality Assurance of massive LabVIEW SCADA System
for machinery supplier in the energy industry
The Challenge
A supplier of machinery for the energy industry who was developing a massive SCADA system in LabVIEW, felt they needed to get assurance that the system was of good quality and was ready for 24/7 operation before delivery to the end customer.
The Solution
The supplier asked WireFlow to do a review of the system, with the goal of finding potential problems to ensure a 24/7 working application, and to highlight any issues that could cause performance degradation over time or increased communication delays.
Background
LabVIEW is programmed in a graphical environment, and this more or less requires a review to be graphical as well. You cannot simply say that just because the code is ugly it doesn’t work, but you can offer guidance on how to improve the code for readability and performance.
One challenge with a review like this is that the system has already grown so much that it will be hard to do any major changes, just because of the sheer number of code modules that may be affected. Another challenge is that the amount of code to go through is more than you can do in a limited period of time.
The primary goal of the review was to:
- Find potential problems to ensure a 24/7 working application
- Find any bottlenecks that could cause performance degradation or delays in communication
- Find points of improvements for the code
The secondary goal was to look at the overall design, and if needed propose changes for future updates.
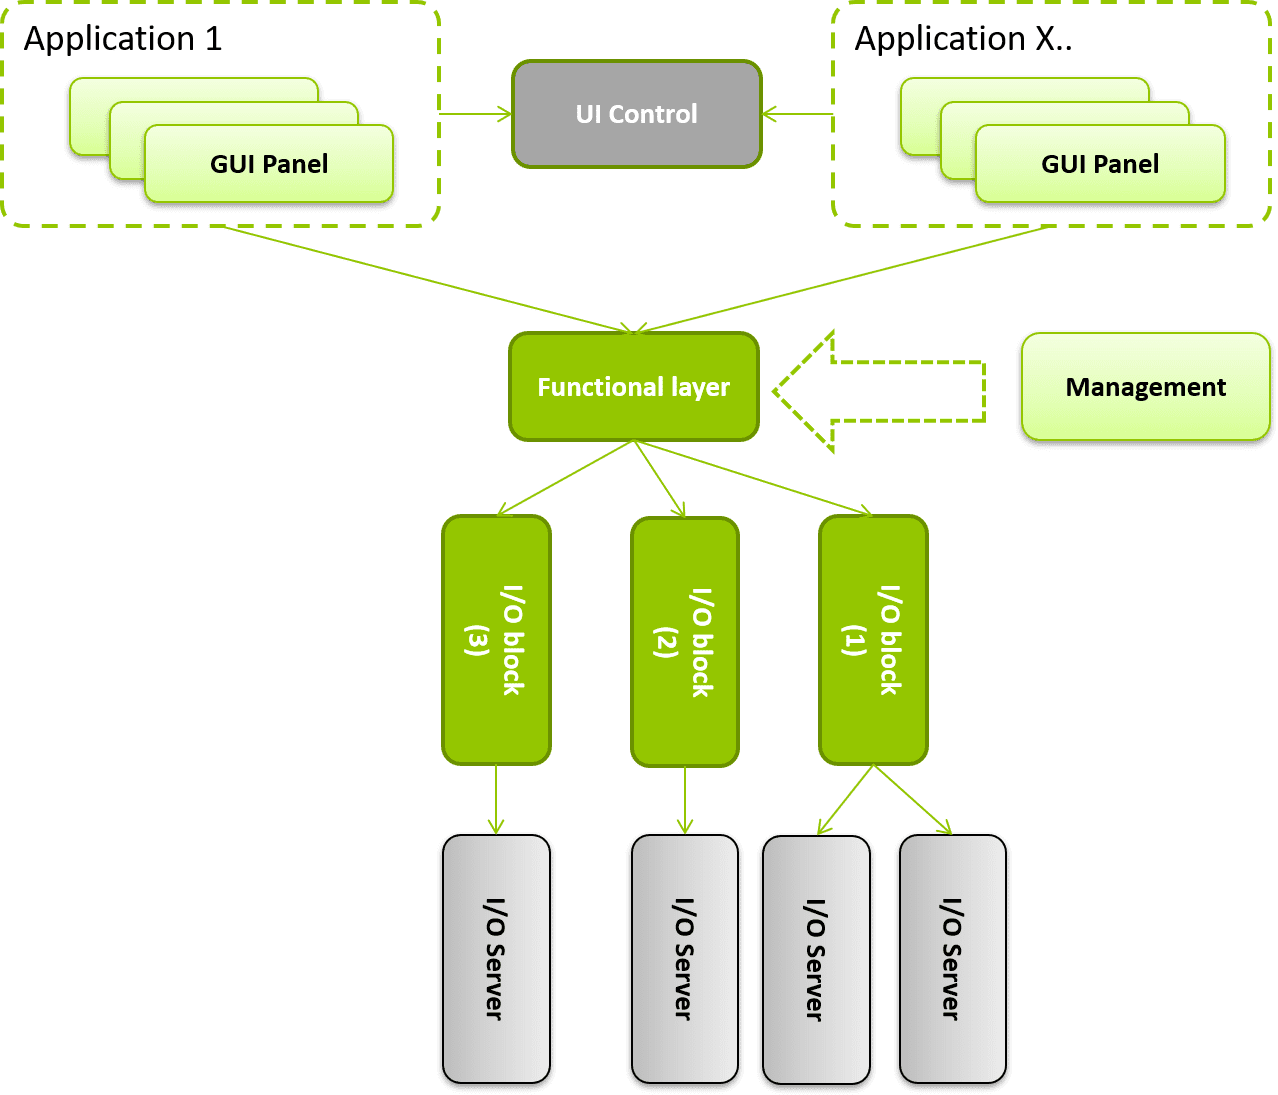
The application
The application to review consisted of:
- Thousands of VIs
- Hundreds of xControls
- Thousands of Shared Variables
- Multiple interacting applications
- Dynamically loaded user interface with 20+ different user panels
- Redundant communication
- Redundant applications.
The Review Workflow
There is no single tool that will find all the potential issues we are looking for, so we used several different tools:
VI Analyzer
- Documentation and most style guide issues can be detected with the VI Analyzer toolkit
- Runs in development with the code in idle mode
Desktop Execution Trace Toolkit (DETT)
- Executes in parallel to the application, and requires the application to run – affects the performance of the application to some degree.
- Memory leaks due to orphaned references and some performance bottlenecks can be detected using DETT.
- DETT can also help detect unhandled errors etc.
Profile Performance and Memory
- Executes in parallel to the application and requires the application to be running – affects the performance of the application to some degree.
- This LabVIEW tool is also used to detect performance and memory issues.
None of the mentioned tools will be able to detect if the code is actually doing what it is supposed to do, so we still have to manually review all the code to find functional issues.
In this application we also used a small internal tool for the review to be able to quickly view and log review comments for VIs.
Preparation
First, we needed to decide how the result should be recorded and presented to the team. With limited time and thousands of VIs there is no time to write a report for each single VI.
Instead we decided what main issues we would like to detect and present, e.g.
- Unclosed references and memory leaks
- Bad coding that requires refactoring
- General bugs
Decide how to record data
All findings have to be recorded so that we can follow up on all issues. In this case all issues were recorded in an Excel document that was transferred to the client’s bug-tracking system.
Prioritize review elements
Next we put different priorities on the different types of issues, e.g.
Prio 1.
The highest priority is used for obvious bugs and memory leaks. Code doesn’t execute as intended, e.g.
- Implementation doesn’t match documentation
- Race conditions
- Bad error handling – errors dropped
- Reference closed in bad locations – causing potential hangs etc.
Prio 2.
Refactoring needed, or minor potential bug, e.g.
- The code is hard to follow to determine functionality and needs cleaning-up
- Perform calculations on arrays instead of scalars
Prio 3.
Coding style, documentation etc. needs work
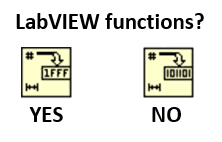
- Icons too similar to LabVIEW native functions
- Wiring
- Error handling
Prio 4.
- Suggestions for the future, e.g. change of function to do a task
Here there was a decision to focus on Prio 1 and 2, but still record issues of Prio 3 and higher if they were detected.
Analyze the source
One of the first things to do when reviewing a big application like this is to analyze the source code. The analysis should be fairly quick, but still give us a feeling of the code quality and should also help us detect the different parts of the application.
When we view the code to find the different modules, it is important to remember that grouping of code can be done in many different ways, e.g. code can be grouped by ownership of a library (lvlib or lvclass), by name-spacing (e.g. <GROUP>_<METHOD-NAME>) or just by their storage location. In this specific case, the code was only separated by the disk location, and a number of shared resources (e.g. globals) prevented easy scaling of the application
Find Dependencies
When we have a feeling for the code regarding size, quality, modularity etc., it is time to find the dependencies between code modules.
The dependencies will help us prioritize the work, especially if the amount of time is limited. By focusing on code modules that are used most extensively and that contains critical components, we can identify risks efficiently.
The challenge in this case was that code modules were defined by their file locations, and that some dependencies created links back and forth between code modules.
The Review
To speed up the review process of all LabVIEW files we created a simple LabVIEW application that allowed us to open the next VI to review, and add the comments and issues to the file directly.
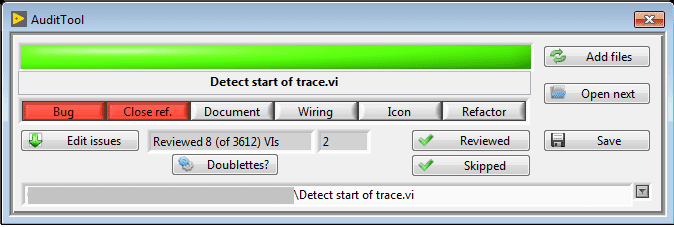
Figure 1. The review tool
This tool helped us keep track of how many files we reviewed, and we never had to search for a VI in memory or on disk since the tool opened the VIs directly. It also saved a lot of time because it had support to copy comments from other reviewed VIs, and the same types of mistakes are often seen more than once.
It also saved a lot of time because it had support to copy comments from other reviewed VIs, and the same types of mistakes are often seen more than once.
Example of review comments:
Bug comments
Strange usage of a queue, opening and closing a named queue and forcing a queue handle to stay in memory. In case “Wait For Next Item” there is no timeout specified, and since this VI is not reentrant it means that the system will hang unless there already is an item in the queue.
Not a good idea to link between different xControls, better to use a common library for the shared dialogs. The references for all VIs should be able to open once, and then retain the reference.
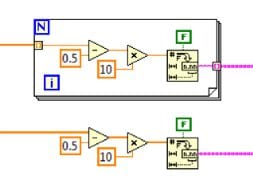
Refactor comments
Wrong usage of DeferPanelUpdates. My guess is that this is because the slider is not updated if set to TRUE. I would move the DeferPanel code into the actual tree update VI. Without DeferPanel tree updates are way too slow.
It is not a good idea to have one VI load panels for all types of subpanel. If a VI have subpanels it should only load the panels it knows about. Like it is right now it makes the code less scalable.
The result
Once all VIs have been reviewed and all data has been documented it is time to analyze all the findings and start planning the work to solve the issues. Since the data is logged in Excel, we can easily create some charts to display the results.
This is even clearer when you look at the distribution of issues relative the priority (see Figure 3). We had only a few issues that needed an immediate fix. All major issues were fixed in a few weeks’ time, and the product was released. After the review the whole team sat down and had a workshop discussing the issues found during the review. And, because most of the issues were documentation, icon and wiring, a style guide with tips and tricks to avoid future issues was written.
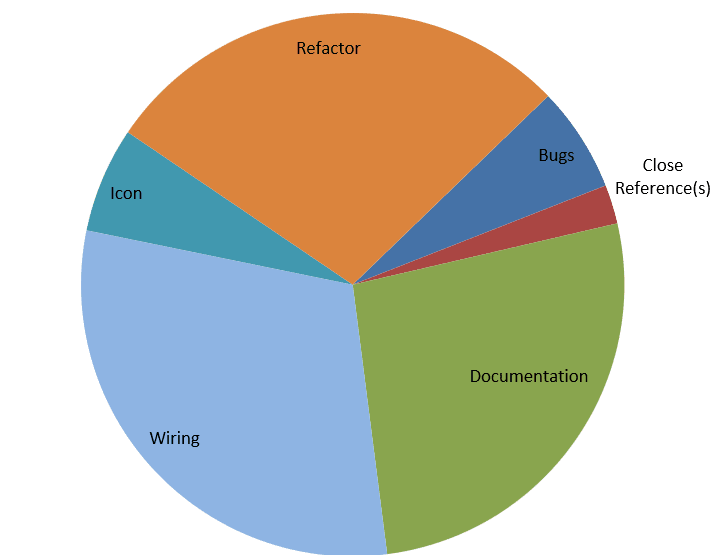
Figure 2. Issues by type
In this example most of the issues were more or less minor (see Figure 2), i.e. documentation, wiring and icons didn’t really follow any style guide.
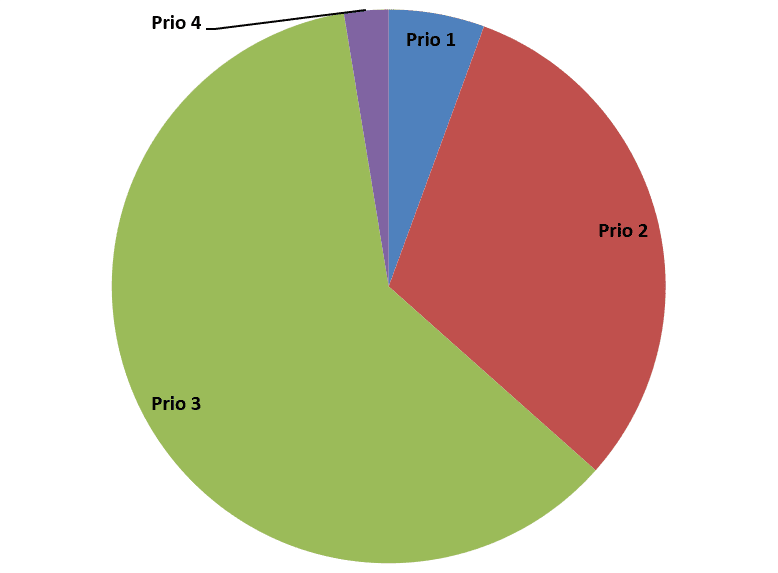
Figure 3. Issues by priority
This is even clearer when you look at the distribution of issues relative the priority (see Figure 3). We had only a few issues that needed an immediate fix. All major issues were fixed in a few weeks’ time, and the product was released. After the review the whole team sat down and had a workshop discussing the issues found during the review. And, because most of the issues were documentation, icon and wiring, a style guide with tips and tricks to avoid future issues was written.
The Future
Future versions of the application will continue to build on the result of the review.
The review process resulted in:
A style guide for future implementations
- improves file layout
- documentation and icon rules
Next generation will be more modularized, thus creating:
- looser coupling, higher cohesion and better abstraction for easier maintenance and debugging
- increased scalability of the application
Intra-process communication will be upgraded to avoid future performance issues.